


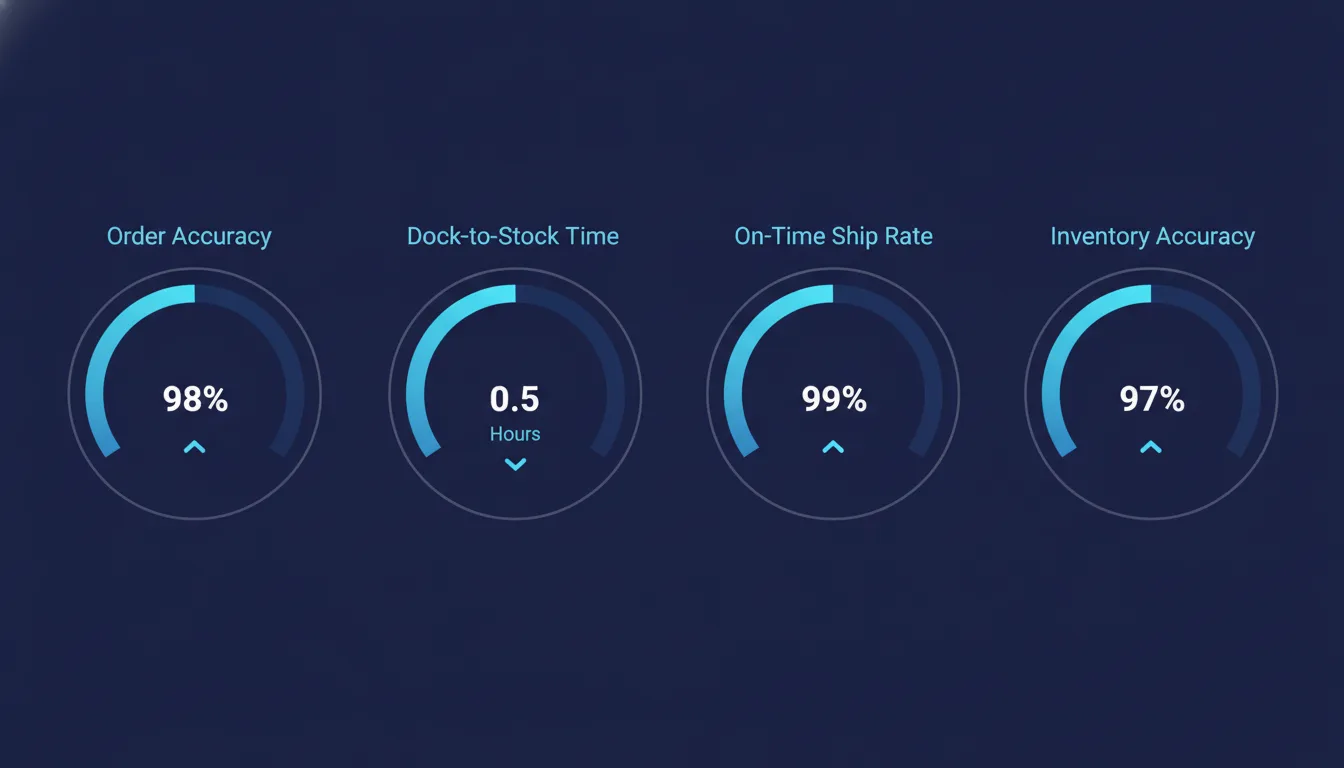
Order fulfillment KPIs are the quantitative measures that tell an ecommerce brand whether its third-party logistics partner is shipping orders correctly, quickly and cost-effectively. The four metrics that belong in every monthly 3PL review are order accuracy rate, dock-to-stock time, on-time ship rate and inventory record accuracy. YouParcel surfaces all four in real time so brands can act on data before small deviations become costly problems.
- Order accuracy rate measures the percentage of orders shipped without an error in item, quantity or packaging, and should consistently exceed 99%.
- Dock-to-stock time tracks how long inbound inventory takes to become available for sale after arriving at the warehouse.
- On-time ship rate shows what share of orders leave the facility by the promised carrier cutoff, directly affecting customer experience and marketplace standing.
- Inventory record accuracy compares physical stock counts to system quantities and exposes shrinkage, mislabeling and receiving errors before they cause stockouts or oversells.
Why a monthly cadence beats quarterly reviews
Quarterly reviews let problems compound for up to 90 days before anyone acts. Peak season errors discovered in a Q4 review are already baked into thousands of returns and chargebacks. A monthly cadence gives you 12 checkpoints a year, short enough to catch a drift in pick accuracy before it inflates your defect rate on Amazon or Shopify.
The right meeting structure is simple: 30 minutes, four KPIs, one owner from each side. Bring a rolling 30-day trend line, not just the current month's snapshot, so you can separate a one-week anomaly from a genuine decline.
Order accuracy rate: the most visible fulfillment KPI
Definition and formula
Order accuracy rate (sometimes called perfect order rate at the line level) is the share of outbound orders that contain the correct items in the correct quantities with the correct packaging, without any post-ship correction. The formula is straightforward:
Order accuracy rate = (Orders shipped without error / Total orders shipped) x 100
An operation processing 5,000 orders a month with 35 errors produces an accuracy rate of 99.3%. That sounds good until you calculate that 35 unhappy customers a month adds up to 420 per year, each generating a return, a reshipping cost, and a potential negative review.
What causes order inaccuracy?
The most common root causes are mis-picks at the shelf location, quantity errors during kitting and assembly, SKU confusion when a brand has very similar product variants, and label misapplication where the right box gets the wrong label. In a monthly review, ask your 3PL to break errors down by cause code so you can target the one that is driving the most volume.
Benchmarks and action thresholds
Industry operations references cite world-class order accuracy above 99.5% for pick-and-pack fulfillment. A rate between 98% and 99% warrants a root-cause conversation. Anything below 98% over two consecutive months is a formal corrective-action trigger. According to the Council of Supply Chain Management Professionals (CSCMP), perfect order performance is one of the most widely tracked 3PL metrics across North American distribution operations.
| Accuracy rate | Interpretation | Suggested action |
|---|---|---|
| 99.5% and above | World-class | Maintain; monitor monthly |
| 99.0% to 99.4% | Acceptable, watch trend | Identify top error type; set 60-day improvement goal |
| 98.0% to 98.9% | Below standard | Formal root-cause analysis; process audit |
| Below 98.0% | Critical | Escalate; define corrective-action plan with deadlines |
Dock-to-stock time: the inbound KPI most brands ignore
Definition and why it matters
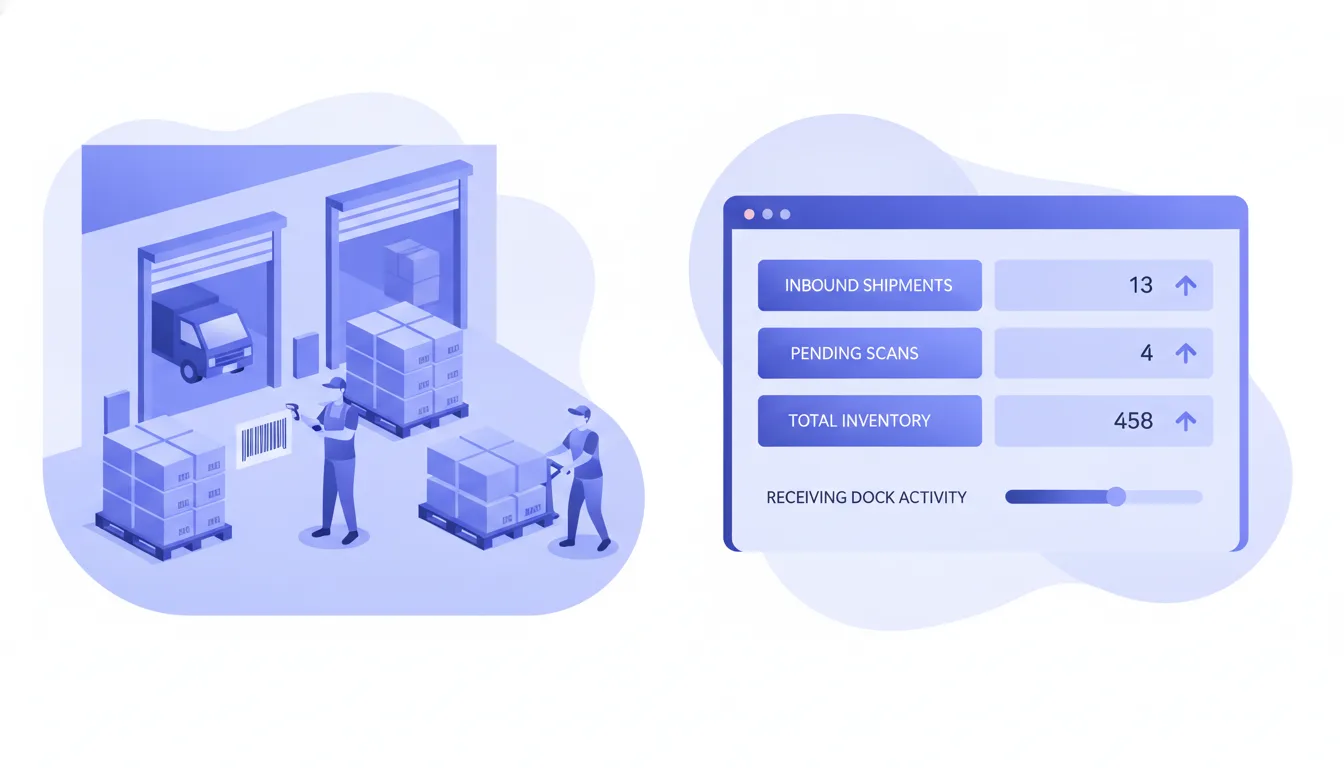
Dock-to-stock time (also called receiving cycle time) is the elapsed time between a shipment's physical arrival at the warehouse dock and the moment its inventory is posted as available for sale in the warehouse management system (WMS). It is measured in hours, not days, for high-velocity operations.
A long dock-to-stock time creates a hidden stockout. Your supplier shipped on time, your freight arrived at the fulfillment center, but customers cannot order the product because it is still sitting in the receiving queue. For brands running tight inventory, two or three days of dock-to-stock delay can mean lost sales and oversell incidents on connected marketplaces.
How to calculate dock-to-stock time
Dock-to-stock time = WMS availability timestamp minus carrier proof-of-delivery timestamp
Ask your 3PL to report this as a median and a 90th percentile, not just an average. Averages hide the tail: a single 72-hour receiving delay for a large pallet shipment can pull the average up by several hours without appearing on a simple mean.
Realistic benchmarks
For standard ecommerce inbound shipments with accurate advance shipping notices (ASNs) and compliant labeling, a well-run 3PL should achieve dock-to-stock times of 24 to 48 hours for standard cartons. Shipments with missing ASNs, non-compliant pallets or unlabeled inner packs will take longer because staff must spend time reconciling quantities and applying labels before they can receive inventory into the system.
The single most effective thing a brand can do to shorten dock-to-stock time is send an accurate ASN before the shipment arrives, with GS1-128 carton labels or agreed-upon labeling that matches the expected SKUs and quantities exactly.
On-time ship rate: the KPI your customers feel directly
Definition and formula
On-time ship rate is the percentage of orders that leave the fulfillment center by the carrier pickup cutoff on the date promised to the customer or required by a marketplace's service level agreement (SLA). It is distinct from on-time delivery rate, which measures carrier performance after the package leaves the warehouse. On-time ship rate measures your 3PL's internal throughput.
On-time ship rate = (Orders scanned by carrier by cutoff time / Total orders due for shipment that day) x 100
Why marketplace sellers must track this separately
Amazon's Seller Fulfilled Prime program and similar marketplace programs set explicit on-time dispatch thresholds. Falling below those thresholds can trigger suppression of Prime badging, which has a direct and measurable impact on conversion rates. Even for Fulfilled by Merchant (FBM) sellers, Amazon's late shipment rate metric feeds directly into account health. Shopify orders with missed ship dates generate customer service contacts at a measurably higher rate than on-time shipments.
In a monthly review, segment on-time ship rate by order source (your own site, Amazon, wholesale EDI orders) because each channel may have a different cutoff time and SLA.
What affects on-time ship rate
The most common causes of a declining on-time ship rate are unexpected volume spikes that exceed the fulfillment center's staffing plan, late carrier pickups (which is a carrier issue, not a 3PL issue, and should be tracked separately), a high proportion of orders requiring kitting or custom packaging, and WMS integration delays that push orders into the pick queue late in the day.
If your integration between your ecommerce platform and the 3PL's WMS has latency, an order placed at 10 AM might not appear in the pick queue until noon, cutting the available processing window in half. Ask your 3PL to share order injection timestamps alongside ship timestamps to diagnose this accurately.
Inventory record accuracy: the foundation of everything else
Definition and formula
Inventory record accuracy (IRA) compares the quantity and location of physical stock to what the WMS says should be there. It is typically measured by cycle counting: a rolling program where staff count a subset of SKU locations each day or week without shutting down operations for a full wall-to-wall inventory.
IRA = (Number of locations counted with no discrepancy / Total locations counted) x 100
A discrepancy can be a quantity difference, a wrong SKU in a location, a damaged unit recorded as available, or inventory in an incorrect bin that the system does not know about.
Why IRA is the root cause metric
Low inventory record accuracy is the underlying driver of both order errors and stockout events. If the WMS says you have 200 units of SKU A in location B-14-3 but the physical count is 163, your pick staff will eventually try to pull units that do not exist, causing either an order hold or a substitution error. The 37-unit discrepancy might be shrinkage, a receiving error from three weeks ago, or units that were moved to a different location without a system transfer.
World-class IRA for ecommerce fulfillment is typically cited at 99% or above. Operations below 95% will struggle to maintain order accuracy and on-time ship rate simultaneously.
What to ask your 3PL about cycle counting
Ask how frequently each of your SKU locations is counted, what triggers an off-cycle recount (for example, a pick-short event), and how discrepancies are investigated and resolved. A mature 3PL will have a documented cycle-count policy and will share summary results with you monthly. If your 3PL cannot produce IRA numbers from its WMS, that is itself a significant operational concern.
How to structure your monthly 3PL review meeting
- Pull data 48 hours before the meeting. Both sides should have the same numbers in front of them. Agree on the data source (WMS reports, carrier scans, your OMS) before the first review so there is no time wasted reconciling different systems.
- Review trend lines, not just snapshots. Plot each KPI over the rolling 90 days so you can see whether this month is better or worse than the prior two months. A single bad week in an otherwise strong month looks very different from a three-month slide.
- Segment by channel and SKU class. Order accuracy might be 99.6% overall but 97.8% for your apparel SKUs that require size and color picking. Channel-level segmentation reveals where action is needed.
- Assign one owner and one deadline per issue. An action item without an owner is an intention, not a plan. For each metric below threshold, the meeting should produce a named owner on the 3PL side, a named owner on your side, a corrective action and a date for the next check-in.
- Document and share meeting notes within 24 hours. A written record of what was agreed protects both parties and creates an audit trail if performance disputes arise later.
Using analytics to make reviews faster and more accurate
Manual data pulls from multiple systems slow down the monthly review and introduce reconciliation errors. A 3PL that offers business intelligence and analytics integrated with your ecommerce platforms can surface all four KPIs in a single dashboard, with automated alerts when a metric crosses a threshold between reviews.
YouParcel's business intelligence and analytics tools give brands real-time visibility into order accuracy, inventory positions and fulfillment throughput across its warehouse network in New Jersey, California and Illinois. Integrations with Shopify, Amazon, Salesforce and 70+ other platforms mean the data flows automatically rather than requiring manual exports.
If you want to broaden your KPI tracking beyond fulfillment-specific metrics into broader supply chain performance indicators, the supply chain KPIs guide covering perfect order rate and cash-to-cash cycle time covers complementary metrics including supplier lead time variability.
Common mistakes brands make in KPI reviews
The most frequent mistake is accepting a verbal assurance instead of a data export. If your 3PL tells you order accuracy is fine but cannot produce a report showing individual error records and root-cause codes, you are reviewing an estimate rather than a measurement.
A second common mistake is conflating carrier performance with 3PL performance. If packages are leaving the warehouse on time but arriving late because of carrier transit delays, that is a carrier network issue. Hold your 3PL accountable for on-time ship rate and work separately with carriers on transit reliability. USPS, FedEx, DHL and other carriers each publish their own service standard documentation, and carrier-specific delays during peak periods are not within a 3PL's control once the package is scanned. The MHI supply chain fundamentals resource provides a useful reference for distinguishing internal operational metrics from external carrier metrics.
A third mistake is measuring too many KPIs at once and giving none of them enough attention. Four metrics reviewed rigorously every month is more valuable than twelve metrics reviewed superficially. Start with order accuracy, dock-to-stock time, on-time ship rate and inventory record accuracy, and add metrics only when you have a stable measurement process for the core four.
Frequently asked questions
What is a good order accuracy rate for ecommerce fulfillment?
World-class ecommerce order accuracy is generally cited at 99.5% or above. A rate below 99% over two consecutive months warrants a formal root-cause review with your 3PL, as each percentage point of inaccuracy translates directly into returns costs, reshipping expenses and customer satisfaction damage at scale.
How is dock-to-stock time different from lead time?
Lead time covers the entire span from purchase order placement to inventory receipt. Dock-to-stock time is only the internal warehouse portion: from when a shipment physically arrives at the receiving dock to when that inventory becomes available for picking in the WMS. It is a 3PL operational metric, not a supplier or freight metric.
How often should I review fulfillment KPIs with my 3PL?
Monthly reviews are the standard for stable operations. If you are scaling rapidly, launching new SKUs, or coming out of a peak season, a bi-weekly cadence for one or two months helps you catch and correct problems faster before they compound.
Can my 3PL be responsible for on-time delivery, or only on-time shipping?
Your 3PL controls the processes inside the warehouse, so on-time ship rate (departing by carrier cutoff) is a fair 3PL metric. On-time delivery depends on carrier performance after the package is tendered and is better tracked as a carrier scorecard metric, separate from your 3PL review.
What causes low inventory record accuracy at a 3PL?
The most common causes are inbound receiving errors (quantities not verified against ASNs), mis-stow events where product is placed in the wrong bin location, pick-short incidents that are not immediately investigated, and inadequate cycle-count frequency. A well-run 3PL will investigate every pick-short as a potential IRA discrepancy and recount the affected location before closing the event.
Ready to review these metrics with a 3PL that surfaces them automatically? Talk to an Expert to see how YouParcel's analytics and ecommerce order fulfillment operations can support your monthly review process, from dock-to-stock visibility to real-time order accuracy reporting. You can also create an account to get started with YouParcel today.