


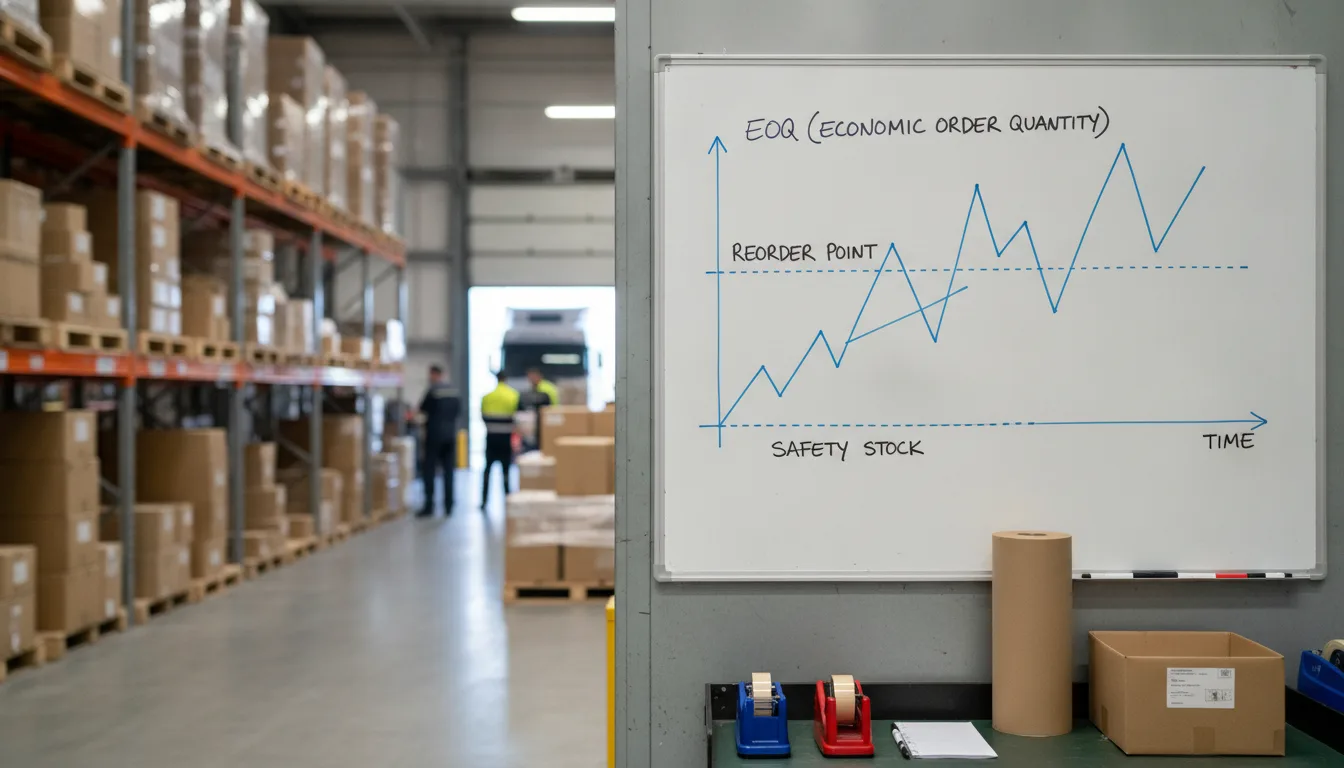
The EOQ formula (Economic Order Quantity) calculates the ideal purchase quantity that minimizes combined ordering and holding costs. Paired with a safety stock formula and a reorder point calculation, it gives ecommerce and wholesale brands a defensible, math-backed replenishment plan before Q4 demand spikes. YouParcel uses these inputs every day across its fulfillment network to help brands avoid stockouts and excess storage charges during the highest-volume weeks of the year.
- Safety stock acts as a buffer against demand variability and supplier lead-time variation; without it, a single late shipment can wipe out a month of sales.
- A reorder point (ROP) tells you exactly when to trigger a purchase order so stock arrives before the buffer runs out.
- The EOQ formula finds the order size that keeps total inventory costs at their lowest, balancing the cost of placing orders against the cost of holding stock.
- Running all three calculations before peak season, not during it, is what separates brands that capture Q4 demand from those that apologize for backorders.
Why Q4 Makes Inventory Math Non-Negotiable
Between early November and late December, daily order volumes at many ecommerce brands rise 40 to 300 percent above baseline, depending on category. Carrier pickup windows tighten. Supplier lead times stretch. Warehouse receiving queues lengthen. Any replenishment model that worked fine in a steady-state environment will show its weaknesses under those conditions.
The three tools below, safety stock, reorder point and EOQ, are not exotic. They appear in every supply chain certification curriculum published by the Council of Supply Chain Management Professionals (CSCMP). What is often missing is a clear, numbers-first walkthrough that shows how they interact. That is what this guide provides.
All numbers below are hypothetical examples created for illustration. Replace them with your own data before making purchasing decisions.
Step 1: Define Your Variables
Before you can run any formula, you need several data points from your own records. Pull them from your warehouse management system, ERP or the BI and analytics reports your 3PL provides.
| Variable | Definition | Hypothetical Example Value |
|---|---|---|
| Average daily demand (Davg) | Units sold per day, averaged over a representative period | 50 units/day |
| Maximum daily demand (Dmax) | Highest single-day demand observed in the period | 90 units/day |
| Average lead time (LTavg) | Days from purchase order placement to goods available in the warehouse | 14 days |
| Maximum lead time (LTmax) | Longest lead time observed across recent orders | 21 days |
| Annual demand (Dannual) | Total units expected to sell in 12 months | 18,000 units |
| Ordering cost (S) | All costs to place and receive one purchase order: admin, shipping, receiving labor | $120 per order |
| Holding cost (H) | Annual cost to store one unit: storage fees, insurance, capital cost, obsolescence | $6 per unit per year |
A note on lead-time data for Q4: Use lead times observed during the prior Q4, not your annual average. Ocean freight transit times and domestic truck capacity compress differently in October and November. If you do not have prior Q4 lead-time data, add a 25 to 40 percent buffer to your average as a conservative estimate.
Step 2: Calculate Safety Stock
Safety stock is the quantity of inventory you hold above your expected demand during lead time, specifically to absorb variation. Holding too little causes stockouts. Holding too much inflates storage costs and, for perishable or seasonal products, creates end-of-season write-offs.
The Basic Safety Stock Formula
The most practical formula for ecommerce brands without sophisticated statistical software uses maximum and average values:
Safety Stock = (Dmax - Davg) x LTmaxPlugging in the hypothetical numbers:
Safety Stock = (90 - 50) x 21
Safety Stock = 40 x 21
Safety Stock = 840 units
This says the brand should hold 840 units as a buffer. If worst-case demand and worst-case lead time occur at the same time, those 840 units prevent a stockout.
When to Use a Z-Score Safety Stock Formula
Brands with clean historical data and normal demand distributions can use a statistically grounded version:
Safety Stock = Z x sigmaLT x DavgWhere Z is the service-level z-score (1.65 for 95%, 2.05 for 98%, 2.33 for 99%) and sigmaLT is the standard deviation of lead time in days. This approach is more precise but requires sufficient historical order and receipt data to compute a reliable standard deviation. For most Q4 planning cycles, the max-minus-average formula above is easier to defend and explain to a supplier or operations team.
Step 3: Calculate Your Reorder Point
The reorder point (ROP) is the inventory level at which you place a new purchase order. When on-hand stock drops to this number, you trigger replenishment. The formula is straightforward:
Reorder Point = (Davg x LTavg) + Safety StockUsing the hypothetical numbers:
Reorder Point = (50 x 14) + 840
Reorder Point = 700 + 840
Reorder Point = 1,540 units
When inventory on hand falls to 1,540 units, it is time to place a purchase order. At average demand and average lead time, those 1,540 units cover the replenishment gap exactly. The 840-unit safety stock layer remains untouched unless demand spikes or the supplier is late.
Adjusting the Reorder Point for Q4
For peak season, consider two adjustments:
- Substitute Q4 lead times. If your supplier's lead time stretches from 14 to 20 days in October, recalculate using LTavg = 20 and LTmax = 28. The ROP will rise accordingly.
- Substitute Q4 demand averages. If your Black Friday week averages 200 units per day rather than 50, build a separate reorder point for that sub-period. Some brands run a standard ROP for September through mid-October and a peak ROP from late October through December, switching between them in their WMS or spreadsheet.
Step 4: Apply the EOQ Formula
The EOQ formula answers a different question: not when to order, but how much to order each time. It finds the quantity at which the sum of annual ordering costs and annual holding costs is lowest.
The EOQ Formula
EOQ = sqrt((2 x Dannual x S) / H)Where:
- Dannual = annual demand in units
- S = ordering cost per purchase order
- H = holding cost per unit per year
Plugging in the hypothetical numbers:
EOQ = sqrt((2 x 18,000 x 120) / 6)
EOQ = sqrt(4,320,000 / 6)
EOQ = sqrt(720,000)
EOQ = 849 units (rounded to nearest whole unit)
The ideal order size, all else equal, is approximately 849 units per purchase order. At that quantity, the cost savings from placing fewer orders balance the carrying cost of holding more inventory.
How Often Will You Order?
Orders per year = Dannual / EOQ = 18,000 / 849 = approximately 21 orders per yearThat works out to roughly one order every 17 days under average conditions. During Q4, demand accelerates, so the interval between orders shortens. If your Q4 monthly demand is 2,500 units rather than 1,500, you will cycle through an EOQ-sized order every 10 to 11 days instead of 17. Plan your purchase order calendar accordingly and confirm with your supplier that they can receive and process orders at that frequency.
EOQ Limitations to Keep in Mind
The EOQ formula assumes a constant demand rate, a fixed ordering cost and no quantity discounts. None of those assumptions hold perfectly in peak season. Use EOQ as a baseline, then apply judgment: if your supplier offers a 5 percent discount at 1,200 units, model that scenario separately. If warehouse space is constrained, cap your order at the available bin capacity regardless of what EOQ says.
Step 5: Choose Your Inventory Valuation Method
The FIFO method (First In, First Out) means the oldest stock is picked and shipped first. FIFO is the standard method for ecommerce fulfillment because it reduces the risk of expiry, style obsolescence and quality degradation. It also aligns with how most 3PLs slot and pick product: goods received first are stored in positions from which they are retrieved first.
In contrast, LIFO (Last In, First Out) is rarely used in physical ecommerce fulfillment. It can create aged inventory problems and is not permitted under International Financial Reporting Standards (IFRS IAS 2), which affects brands with international parent companies or cross-border reporting obligations. For Q4 replenishment planning, FIFO is the correct default assumption when modeling inventory turns and storage duration.
| Method | Picking Order | Best For | Risk |
|---|---|---|---|
| FIFO | Oldest stock first | Perishables, apparel, seasonal goods | Requires disciplined receiving and slotting |
| LIFO | Newest stock first | Non-perishable commodities (limited use cases) | Aged inventory accumulation; not IFRS-compliant |
| FEFO (First Expired, First Out) | Soonest expiry first | Supplements, food, cosmetics | Requires lot-level tracking in WMS |
Step 6: Build a Q4 Replenishment Timeline
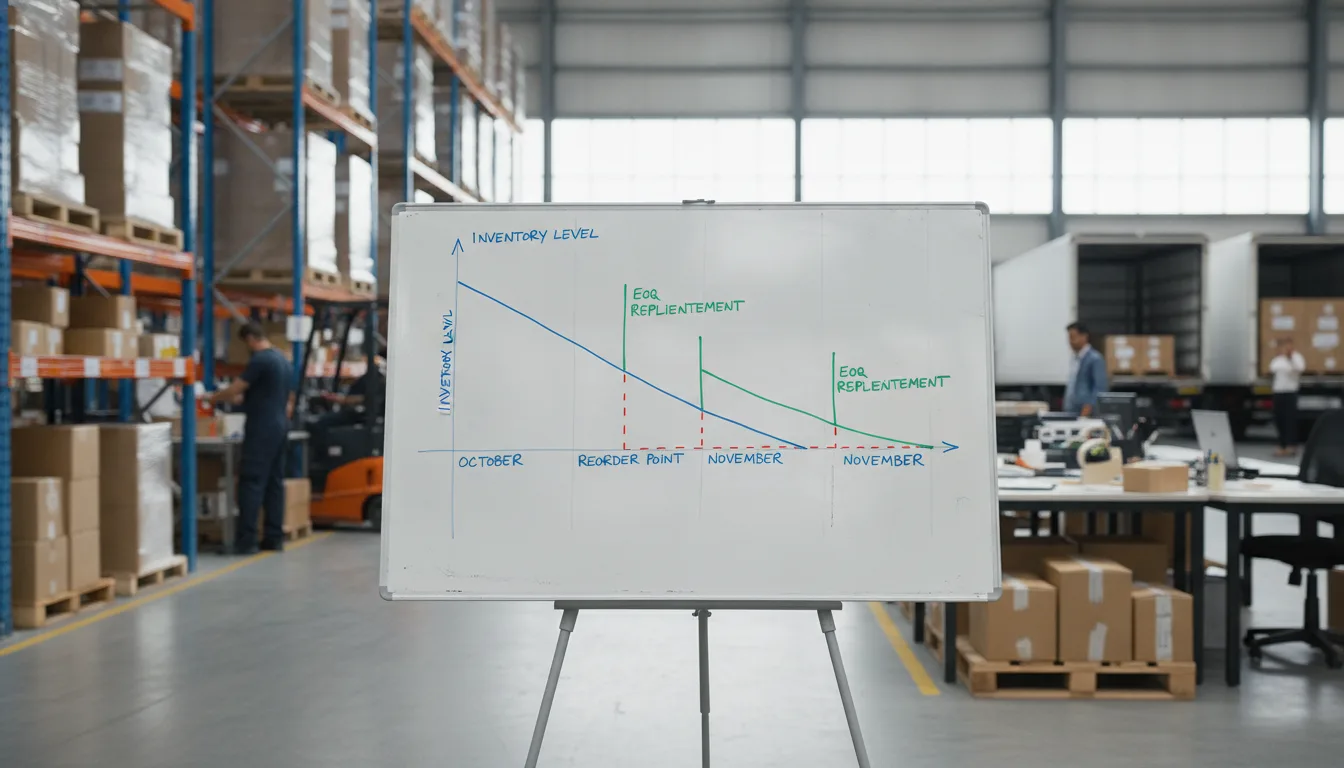
With your safety stock, reorder point and EOQ calculated, you can build a simple replenishment calendar. The example below uses the hypothetical numbers above and a Q4 start date of October 1.
- October 1: Set opening inventory. Target opening stock of at least ROP + EOQ = 1,540 + 849 = 2,389 units. This gives you one full order cycle in hand before demand accelerates.
- October 1 to October 14: Monitor daily. At 50 units per day average, inventory will drop by approximately 700 units in 14 days, reaching around 1,689 units. Watch daily actuals against the trigger.
- When stock hits 1,540 units: Place a purchase order for 849 units. At average demand and average lead time (14 days), stock arrives just as the buffer begins to absorb demand. If demand is running high, hit the trigger earlier.
- November 1: Switch to Q4 demand assumptions. Recalculate using Black Friday demand estimates. If Davg rises to 150 units per day, your effective ROP rises to (150 x 14) + 840 = 2,940 units. Place a pre-peak order to reach that level before the demand surge.
- Post-peak (late December): Review actuals. Compare actual daily demand against estimates. Update Dmax and LTmax from Q4 data to improve next year's calculations.
How a Fulfillment Partner Supports These Calculations
The formulas above are only as good as the data that feeds them. A fulfillment partner with real-time inventory visibility, BI and analytics reporting, and multi-warehouse distribution makes the data reliable and the execution faster.
YouParcel processes 10,000 or more orders per day across multiple marketplaces from fulfillment centers in New Jersey, California and Illinois. Its integrations with Shopify, Amazon, Salesforce, Tableau and 70 or more other platforms mean inventory data flows in real time, so your reorder point trigger is based on live on-hand counts rather than a spreadsheet you updated last week. That gap between live data and stale data is often the difference between catching a reorder trigger at 1,540 units and catching it at 900 units, well inside the safety stock buffer.
For brands managing seasonal surges, YouParcel also supports kitting and assembly, which matters when Q4 gift sets or promotional bundles require pre-assembly before the peak window opens. Learn more about the full ecommerce fulfillment services that support Q4 replenishment execution, from inbound receiving through pick, pack and outbound shipping.
Brands planning their Q4 inventory strategy should also read the guide to calculating the right MOQ for your business, which covers how minimum order quantity constraints from suppliers interact with EOQ and peak-season purchase orders.
Common Mistakes Brands Make With Peak-Season Replenishment
Using Annual Average Demand Instead of Seasonal Demand
The EOQ formula uses annual demand, but your safety stock and reorder point should use the demand rate relevant to the period you are planning for. If Q4 is 40 percent of your annual sales, model it with Q4 demand rates, not the annual daily average.
Ignoring Lead-Time Variability at the Source
Many brands track lead time from the day goods leave the supplier's factory. The correct measurement is from the day the purchase order is placed to the day goods are received and available for picking. That includes factory production time, domestic freight, export clearance, ocean or air transit, US customs clearance and 3PL receiving. Each stage adds variability, and all of it must be in your LTmax.
Not Accounting for Receiving Delays at the 3PL
Even when goods arrive at the fulfillment center on time, receiving queues during peak season can add one to five days before inventory is counted and available. Factor that into your effective lead time, and communicate inbound shipment advance shipping notices (ASNs) to your 3PL as early as possible so they can prioritize receiving.
Treating Safety Stock as a Static Number Year-Round
Safety stock is a function of demand variability and lead-time variability. Both change by season. Recalculate at least quarterly: once for Q4 planning (August or September), once for post-peak reset (January) and once mid-year. Some brands recalculate monthly for fast-moving SKUs.
Summary: The Three Formulas Side by Side
| Metric | Formula | Hypothetical Result | What It Tells You |
|---|---|---|---|
| Safety Stock | (Dmax - Davg) x LTmax | 840 units | Buffer against worst-case demand and lead-time variance |
| Reorder Point | (Davg x LTavg) + Safety Stock | 1,540 units | Inventory level that triggers a new purchase order |
| EOQ | sqrt((2 x Dannual x S) / H) | 849 units | Order quantity that minimizes total annual ordering and holding costs |
Frequently Asked Questions
What is the EOQ formula and when should I use it?
The EOQ formula calculates the order quantity that minimizes the combined cost of placing purchase orders and holding inventory. Use it when demand is relatively stable, you have a known ordering cost and a known annual holding cost per unit. For peak season, treat the EOQ as a baseline and adjust upward or downward based on supplier constraints, available warehouse space and volume discounts.
How much safety stock should I hold for Black Friday and Cyber Monday?
The right safety stock level depends on your demand variability, your supplier's lead-time reliability and how much stockout risk you can accept. Use the formula (Dmax - Davg) x LTmax with Q4-specific demand and lead-time figures rather than annual averages. As a sanity check, your safety stock should cover at least the difference between your expected Q4 daily peak and your average daily demand across your longest observed lead time.
What is the FIFO method in inventory management?
FIFO (First In, First Out) means you sell or ship the oldest inventory first. It is the standard method for ecommerce fulfillment because it prevents product aging, reduces expiry risk and matches the natural flow of goods through a warehouse. Most 3PLs enforce FIFO by default through their warehouse management systems.
How does a reorder point differ from safety stock?
Safety stock is a quantity held as a buffer. The reorder point is the inventory level at which you place a new order. The reorder point includes the safety stock: it equals expected demand during lead time plus the safety stock buffer. When stock drops to the reorder point, you order; the safety stock portion remains as protection unless demand or lead time exceeds expectations.
Can a 3PL automatically trigger reorders when I hit my reorder point?
Some 3PLs with WMS and ERP integrations can send automated low-stock alerts or trigger purchase orders when inventory falls below a configured threshold. YouParcel provides real-time inventory visibility and integrates with 70 or more platforms, which allows brands to set up automated alerts and dashboard triggers through their own ERP or Shopify store. The reorder decision itself typically remains with the brand, but the data is live and actionable.
Ready to Put These Numbers Into Practice?
Calculating safety stock, reorder points and EOQ is straightforward. Executing on them, coordinating inbound freight, timely receiving, real-time inventory counts and outbound fulfillment across multiple channels, requires a fulfillment partner with the capacity and technology to keep pace with Q4 demand. Talk to an expert at YouParcel to discuss your Q4 replenishment plan and how the fulfillment network can support it.